 Graphics from the Netdata blog
Fixing hidden infrastructure issues with Netdata
As developers, we deal with fixing bugs every day. If your error messages are clear, it's often quite easy to fix these issues. Fixing issues for a single application is also not the most difficult thing in the world. You'll have to keep track of a limited amount of moving parts that could potentially go wrong. But what happens when you're developing an entire platform consisting of multiple services? How do you keep track of potential issues between them at scale? And how do you deal with discovering issues if different services are spread out over multiple nodes?
When dealing with larger infrastructures, you're going to need good monitoring solutions you can very easily deploy on multiple nodes at the same time, using reproducible steps. One of the monitoring solutions that fit this description perfectly is Netdata.
In this post, I'm explaining why Netdata is a great option for your infrastructure monitoring and how it has helped me to fix a major problem with my infrastructure within the first hour of installing it onto some servers.
What is Netdata?
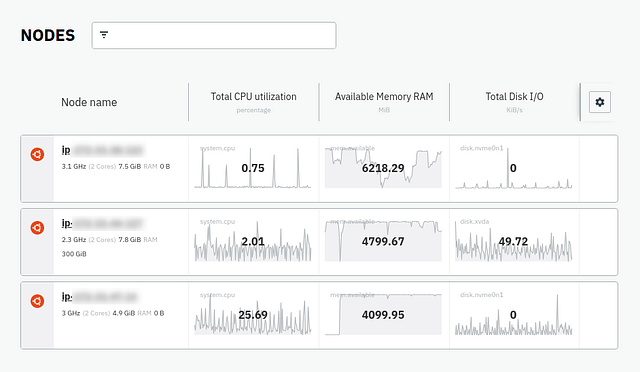
Netdata is monitoring software for servers, but really anything that runs Linux. So you could also install this on your workstation and keep track of your system resources using Netdata, instead of top or htop. Netdata comes with a built-in dashboard that you can access at https://localhost:19999 on your local machine and you'll see all system information you could ever want. However, when you've deployed this on multiple nodes, you can feed this data into Netdata Cloud and all of them in your dashboard at the same time. You can see all resource usage of your entire infrastructure at a single glance.
 Netdata Cloud dashboard with multiple servers
Why Netdata?
Netdata is very easy to install and comes with a few nice features, which makes it perfect for infrastructure monitoring. You can install the Netdata client on your devices (including all nodes in your infrastructure) and connect it to a single dashboard: Netdata Cloud. This is a free dashboard you can feed all of your nodes' information into to create a clean overview of your servers and their health statuses. This dashboard shows you CPU usage, RAM usage, inbound/outbound bandwidth, and a lot more information that you could use to figure out the health of your nodes.
Information is all great, but it's not good enough if deploying Netdata to all your servers automatically isn't possible. Luckily, you can install Netdata using bash scripts, and adding each individual node to your Netdata Cloud dashboard is, yet again, a bash script. This means you can automate this process using, you could've expected this, Ansible. Ansible helps you to run the same script on multiple nodes automatically, in a reproducible way. This is a perfect match with Netdata, because the installation is easy and reproducible. Adding the installation scripts for Netdata to Ansible ensure that you're always able to monitor the status of your nodes, as soon as they've launched.
Running a few bash scripts is quite easy, just make sure you know what you're executing when you run bash scripts from the internet.
Installing the client is a single line, which you'll need to run on your target node (the server):
bash <(curl -Ss https://my-netdata.io/kickstart.sh)After you've created an account on Netdata Cloud, all you need to do to link the Netdata client to your Cloud account is run a script similar to this on your target node:
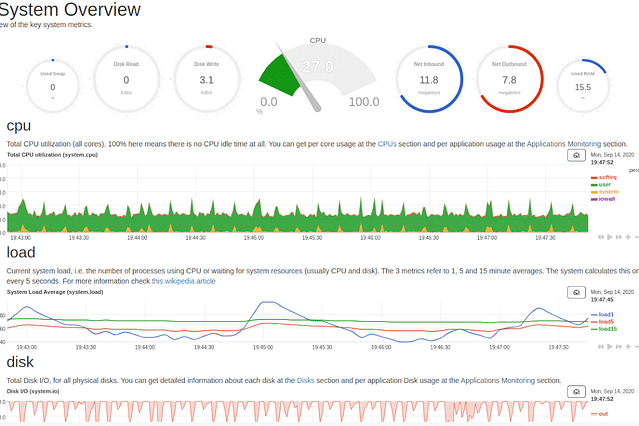
sudo netdata-claim.sh -token=your_token -rooms=your_room -url=https://app.netdata.cloudYou'll be given a token and room identifier in Netdata Cloud, so don't worry about copy/pasting this line above. Now your server will automatically be connected to Netdata Cloud and you'll be able to see all kinds of metrics. Below are some of the metrics you might see in your dashboard:
 Netdata system overview
The data transfer is done through SSH tunnels, so you can be rest assured that it's safe.
How Netdata helped me fix a major issue within the first hour
Now that you know what Netdata is and have gotten a little overview of what it can show you, let's go into how it helped me to fix a major (hidden) issue within the first hour of deploying it in my infrastructure.
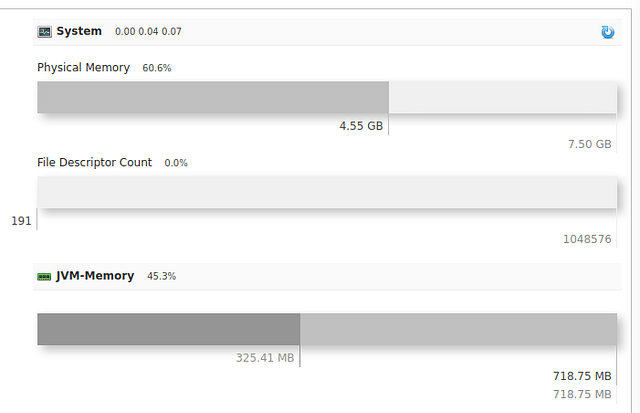
As a little back story, one of the servers is running an Apache Solr instance to serve as a search engine and it has been quite slow over the past few months. Apache Solr has a nice dashboard that shows the memory usage and the JVM memory usage, as it's built using Java.
 Apache Solr memory usage overview
This was always stuck around 90% of memory usage, so I assumed that the performance issues had something to do with RAM limitations. This let me down a path of upgrading the server within AWS to give the Solr instance more memory to work with, but this didn't have the expected results.
After installing Netdata on this server, I saw that the CPU was almost constantly hitting 100% usage, which was strange as the server wasn't under heavy load at the time. It seemed that RAM limitations weren't the issue after all, but the CPU was having a though time. So after a bit of searching around on our favorite search engine, I found this Jira issue. It pointed out that the version we were running (7.7.1) was causing memory issues and that it was patched in the next version (7.7.2). So after upgrading the Apache Solr server to the latest 7.7.x version (7.7.3) the problems were resolved. The search engine was at least 3 times quicker, even under heavy load, while indexing large amounts of documents.
It would've taken me much longer to solve this issue without Netdata, because the memory statistics in the Apache Solr dashboard were misleading, while the usage statistics in Netdata showed the real cause of the problem. You might have been able to solve this issue using top or htop as well, but then you'd already need to know what you were looking for. I was looking in the wrong place and Netdata helped to point me in the right direction.
Conclusion
Using Netdata to visualize the health of several nodes helped me to find an issue that was previously hidden. The monitoring solutions I had available to me all pointed to RAM limitations, while Netdata pointed me to CPU limitations. This different perspective helped me to find and fix a major issue, that has been around for months, within the first hour of installing the software. It has contributed to a more stable and much faster search experience on the platform.
Posted on: September 23rd, 2020I streamline your business with software that actually fits the way you work.
Ready to streamline your business? Let’s chat.
